

Source: World Gold Council
Date: April 30, 2024
Central banks and OTC drove price
Healthy consumer buying offered further support.
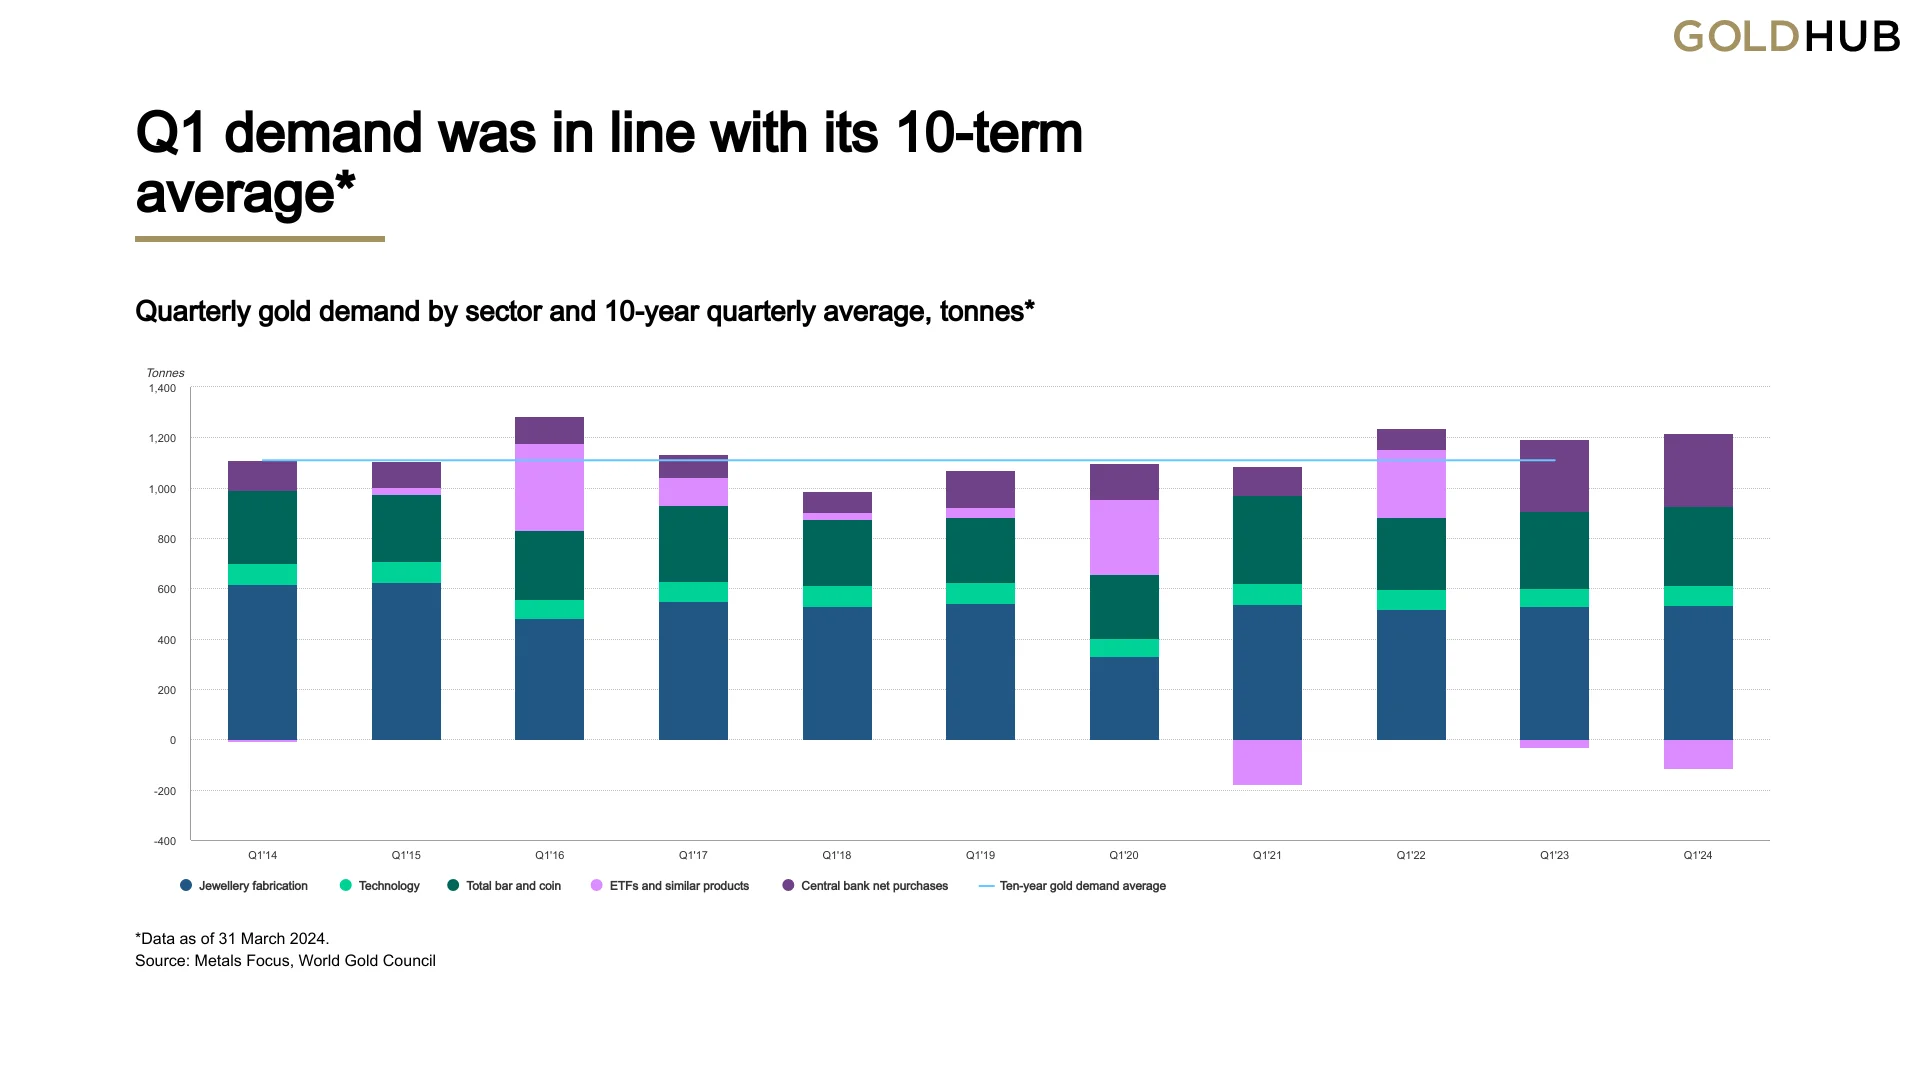
Q1 gold demand (excluding OTC demand) slipped 5% y/y to 1,102t, due to continued ETF outflows. Inclusive of sizable OTC buying by investors, total gold demand increased 3% y/y to 1,238t – the strongest first quarter since 2016.
Q1 saw no let-up in the pace of central bank gold buying: 290t (net) was added to official holdings, only part of which is currently reflected in IMF data.
Bar and coin demand matched the previous quarter at 312t, translating to a 3% y/y increase.
Global gold ETF holdings fell by 114t. Europe and North America both saw quarterly outflows, slightly countered by inflows into Asian-listed products. US-listed funds saw a positive shift late in the quarter.
The jewellery sector was healthy, given the price rally. Global jewellery consumption was just 2% lower y/y at 479t. Jewellery fabrication grew by 1% y/y to 535, resulting in inventory build of 56t during the quarter.
Technology demand for gold recovered 10% y/y as the AI boom boosted demand in the electronics sector.
Highlights
- The LBMA (PM) gold price averaged a record US$2,070/oz in Q1 – 10% higher y/y and 5% higher q/q. Gold scaled new heights in March, closing the quarter at US$2,214/oz.
- Q1 was another quarter of significant OTC demand. OTC buying by investors, while opaque, is reflected in the pace and scale of the price rise. CME net managed money positions, which can be used as a proxy, rose by 91t in Q1.
- Mine production increased 4% y/y to 893t – a record first quarter for our data series. Meanwhile, recycling responded to higher prices, climbing 12% y/y to 351t. This makes it the highest quarter of recycling supply since Q3’20, when it shot up in line with gold prices and as a response to the pandemic.
- Western and Eastern investors exhibited different behaviour. Western gold buying remained robust, but was met with healthy levels of profit-taking. This contrasted with strong buying into the price surge in Eastern markets.
Gold supply and demand
