

Source: Investing Heaven
By: Taki Tsaklanos
Date: December 10, 2023
Silver will move higher in 2024 because the top in Yields is confirmed. The US Dollar did already confirm its inability to move much higher. Both are supportive developments for precious metals. Our silver price forecast 2024 is supported by those leading indicators, and also by inflation expectations and silver’s CoT report. All those indicators suggest that 2024 will bring bullish drivers for silver. That’s why our silver price forecast for 2024 is 34.70 USD. Note that this is our first bullish target. Once silver moves to 34.70 USD, it will be a matter of time until it hits all-time highs. We tipped silver as the precious metal to buy for 2024.
Ed. note added on Dec 11th: we added one paragraph at the bottom of this article, in the section Silver price prediction Log, in which we cover the silver price drop right before 2024 kicks off (mid-December of 2023).
Nowadays, the web is full of fake silver price forecasts. Many sites publish large tables, generated by AI, with price calculations for the next years, positioning those endless series of numbers as silver price forecasts.
How does our silver price forecast 2024 relate to our 2023 forecast? Essentially, our forecast did not change whatsoever. All leading indicators are bullish. The only reason why our 2023 silver forecast did not materialize is the unexpected surge in 10-Year Yields, one of silver’s leading indicators, in the period Aug/Oct of 2023. This postponed silver from reaching our first target of 34.70 USD in the summer of 2023.
What is the single most important influencer of the price of silver in order to meet our silver forecast 2024? There are two influencers: silver CoT and 10-Year Yields. The silver CoT positioning is very bullish. That’s why silver needs a small decline in 10-Year Yields in order to start its journey to its first target which is 34.70 USD.
Silver prediction: summary
We re-iterate our bullish stance about the silver market. Our silver price target stands strong.
This is what we wrote throughout most of 2023, all very relevant for our silver forecast 2024:
For 2024, we continue to predict that silver will rise to 28 USD/oz which is a secular breakout level. Whether it will succeed in clearing secular resistance will depend whether 10-Year Yields will confirm a local top. Stated differently, TNX is the last obstacle for silver to move higher. Once silver moves to 28 USD/oz, it will run quickly to the 32-36 area, a move which we expect to occur in the first half of 2024.
As 2024 is about to kick off, we firmly believe that silver has everything that it needs to stage a secular breakout early 2024, maybe even short term. We define short term as 3 weeks to 3 months out. We do expect silver to confirm its breakout in the first part of 2024. We eagerly wait for silver to clear 26 USD/oz which will open the door to surpass 28 and go in one straight line to 34 USD/oz.
Another Silver Price Prediction: Why?
The internet has no shortage of silver price predictions. In fact, InvestingHaven was the first back in 2014 to publish a silver price prediction and repeat it every year. Since then, the number of silver price predictions has exploded. Most of them are absolutely worthless.
We pride ourselves not only being the first one to publish a silver price prediction but also do it in a very diligent way, backed by thorough research.
But there is more.
What we are really interested in is catching the next really big move in silver that might bring it back to 50 USD/oz or even higher. That’s the reason why silver has a top spot in our watchlist.
We write a lot about silver both in the public domain (silver) but also in our premium services. Silver has a track record of running very hard and fast, in both directions. There is a very good reason why silver is called the restless metal.
Silver came very close to a secular breakout in 2022, however the breakout was stopped cold by very aggressive (read: historic) monetary policy interventions in Q2/2022. Once the wave of monetary policy interventions will be over, which we ultimately expect as 2024 kicks off, we see the USD come down. This will make the silver market explosive!
4 leading indicators supporting our silver price prediction
We work with a limited number of leading indicators for our silver price predictions:
- The price of gold (positively correlated to silver).
- The Euro (inversely correlated to the USD).
- Inflation expectations (positively correlated to silver).
- The futures market positioning (CoT).
In 2022, we noticed how a strong rise in the U.S. Dollar and consequently big decline in inflation expectations broke the secular breakout in silver that started in Q1. However, the silver CoT report continued to improve to the extent that it became historically bullish in Q3.
We believe that all leading indicators will turn bullish for silver in 2024, the only one that needs confirmation is 10-Year-Yields: if prices of Treasuries move a little higher, Yields a little lower, it will open the door for silver to finally take off.
Our silver price prediction 2024
We turn to the silver charts to support our silver price forecast 2024.
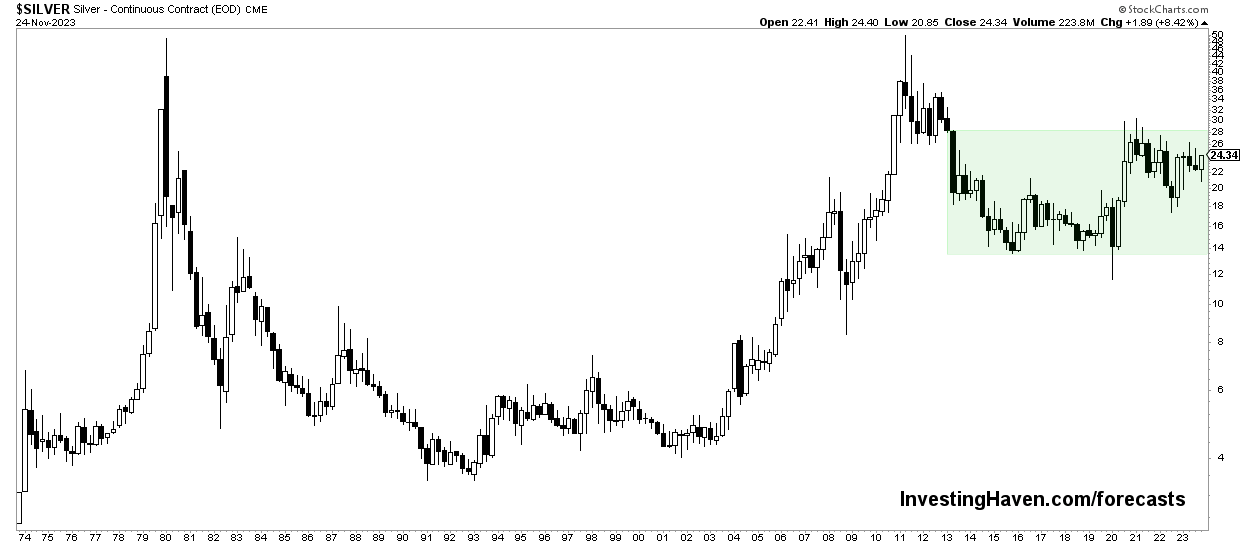
As seen on the longest timeframe, the silver price chart over 50 years, there is a giant cup and handle in the making. This is a strongly bullish pattern, one that might take two more years to truly explode.
The area in green is the ‘handle’, it took some 6 years to create the first part of the structure. The consolidation is taking some 3 years now. We find it challenging to estimate the exact time required for this formation to complete. We can reasonably expect silver to move to the top of this formation (between 32 and 36 USD) in the first half of 2024.
Chart commentary: this chart was updated on Nov 26th, 2023, to ensure an up-to-date quarterly silver price chart. This cup-and-handle reversal is getting stronger with each passing month and quarter. A breakout is in progress, on the daily timeframe and soon on the weekly timeframe as well. On the quarterly silver price chart, the breakout will be in progress once 27 USD/oz is being cleared.
Silver charts that support our forecast
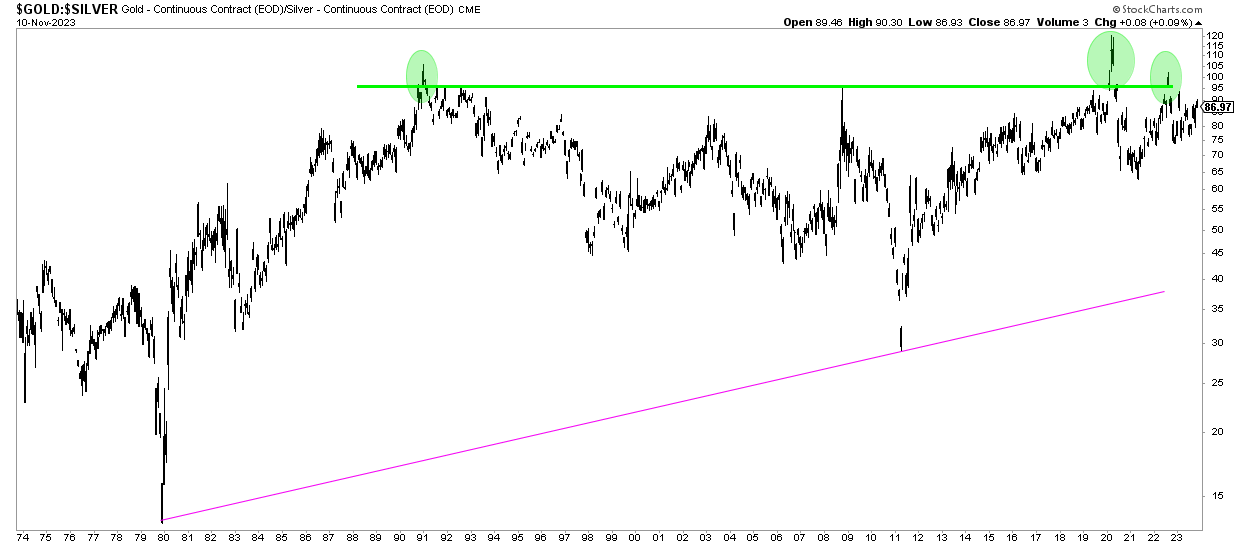
We start with the weekly gold to silver ratio over 50 years.
We explained the importance and the meaning of the gold to silver ratio, in great detail, in this article: Gold-to-Silver Ratio and Historic Silver Rallies:
The historical evidence suggests that the gold-to-silver ratio entering the 80 to 100x range may act as a signal for a significant rally in the price of silver. At this very point in time, the gold to silver ratio chart embedded in this article shows how this ratio is above 80x since early 2022. This ratio is not a timing indicator, it is a stretch indicator. It suggests that silver is extremely undervalued relative to gold, it suggests that it’s a matter of time until spot silver starts reacting to the upside!
The gold to silver ratio chart over 50 years:
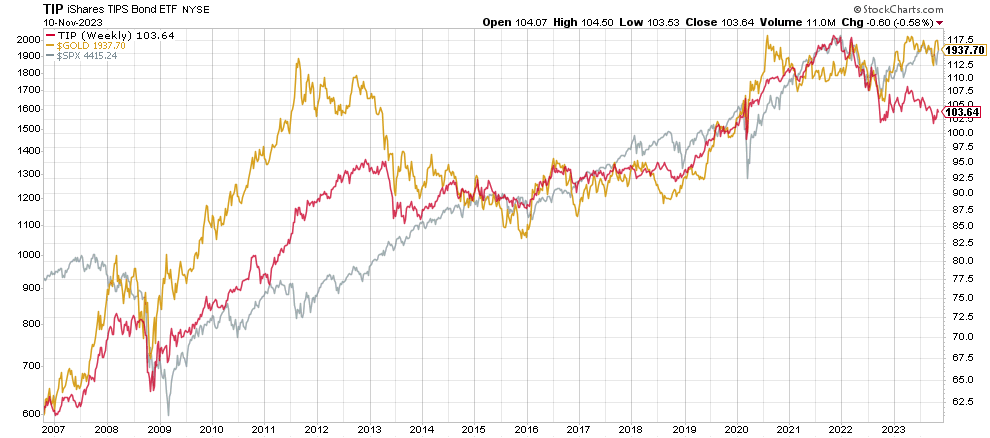
The 2nd chart that supports a higher spot silver price in 2024 is the correlation between inflation expectations (TIP), gold and SPX.
The decline in 2022 in all 3 of them is telling. We expected that all 3 of them will stop declining and turn up in 2023, which happened although without follow-through.
With the correlation between those 3 markets in mind, we look at the current setups in silver / TIP / SPX.
Silver is setting a very strong inverted head & shoulders pattern, stocks are setting a double bottom (pending validation though), TIP looks to be consolidating.
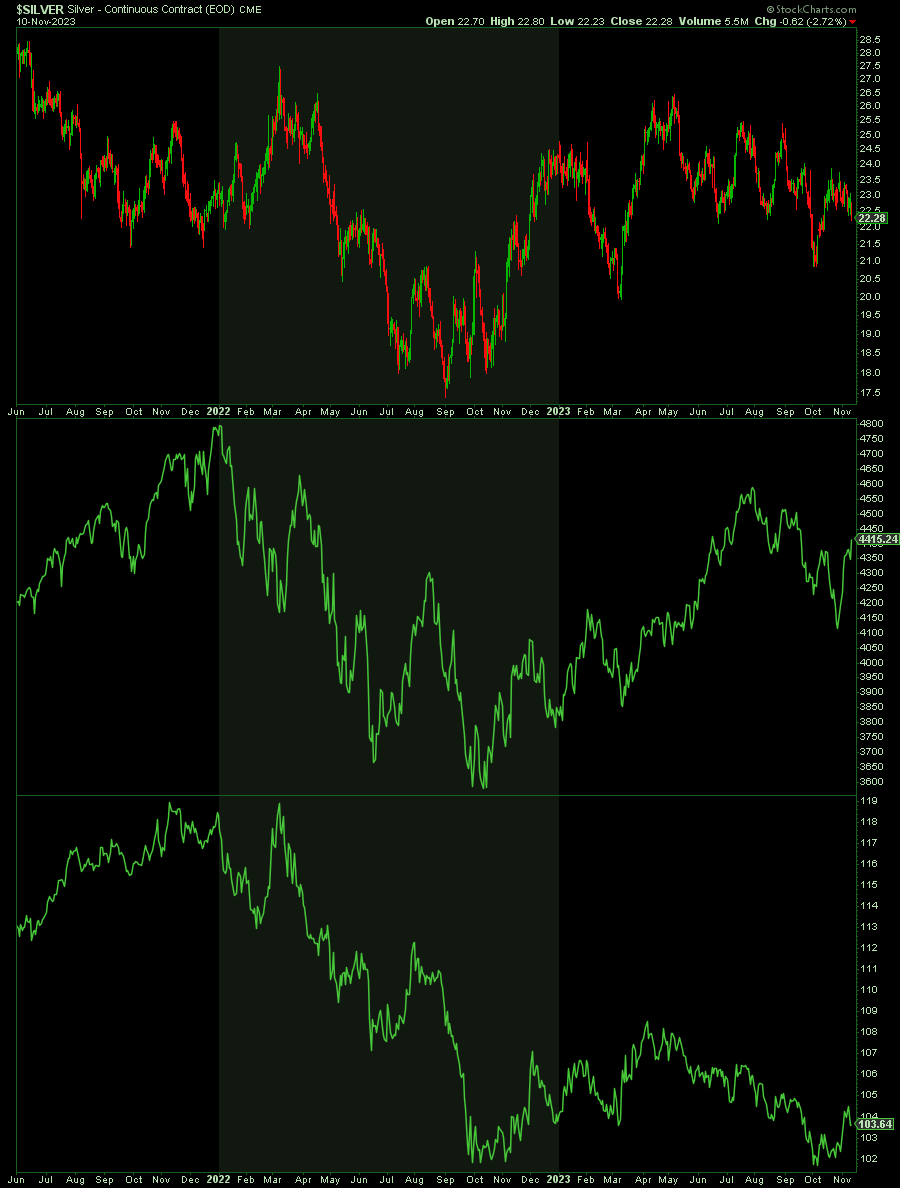
We believe all 3 instruments will move higher in 2024.
Silver’s leading indicator #1: Gold
We expected gold to eventually move higher in 2023, and it happened, driven by the divergence between its leading indicator M2 (the monetary base). The way we look at this leading indicator is that it is now supportive while it had a negative divergence a while ago.
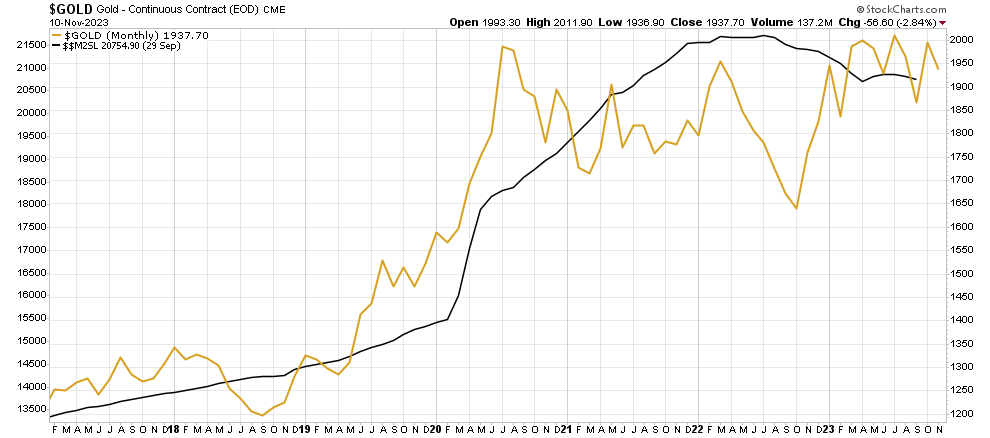
We gave much more detail about the expected path of gold in 2024 in our gold forecast.
Silver’s leading indicator #2: Euro (USD)
Precious metals need a rising Euro (falling or flat USD) in order to shine.
If we look at the Euro chart on the longest timeframe we find 2 bearish targets: 0.9666 and ultimately 0.91-0.92. The first one was hit, the second one might be hit (or not).
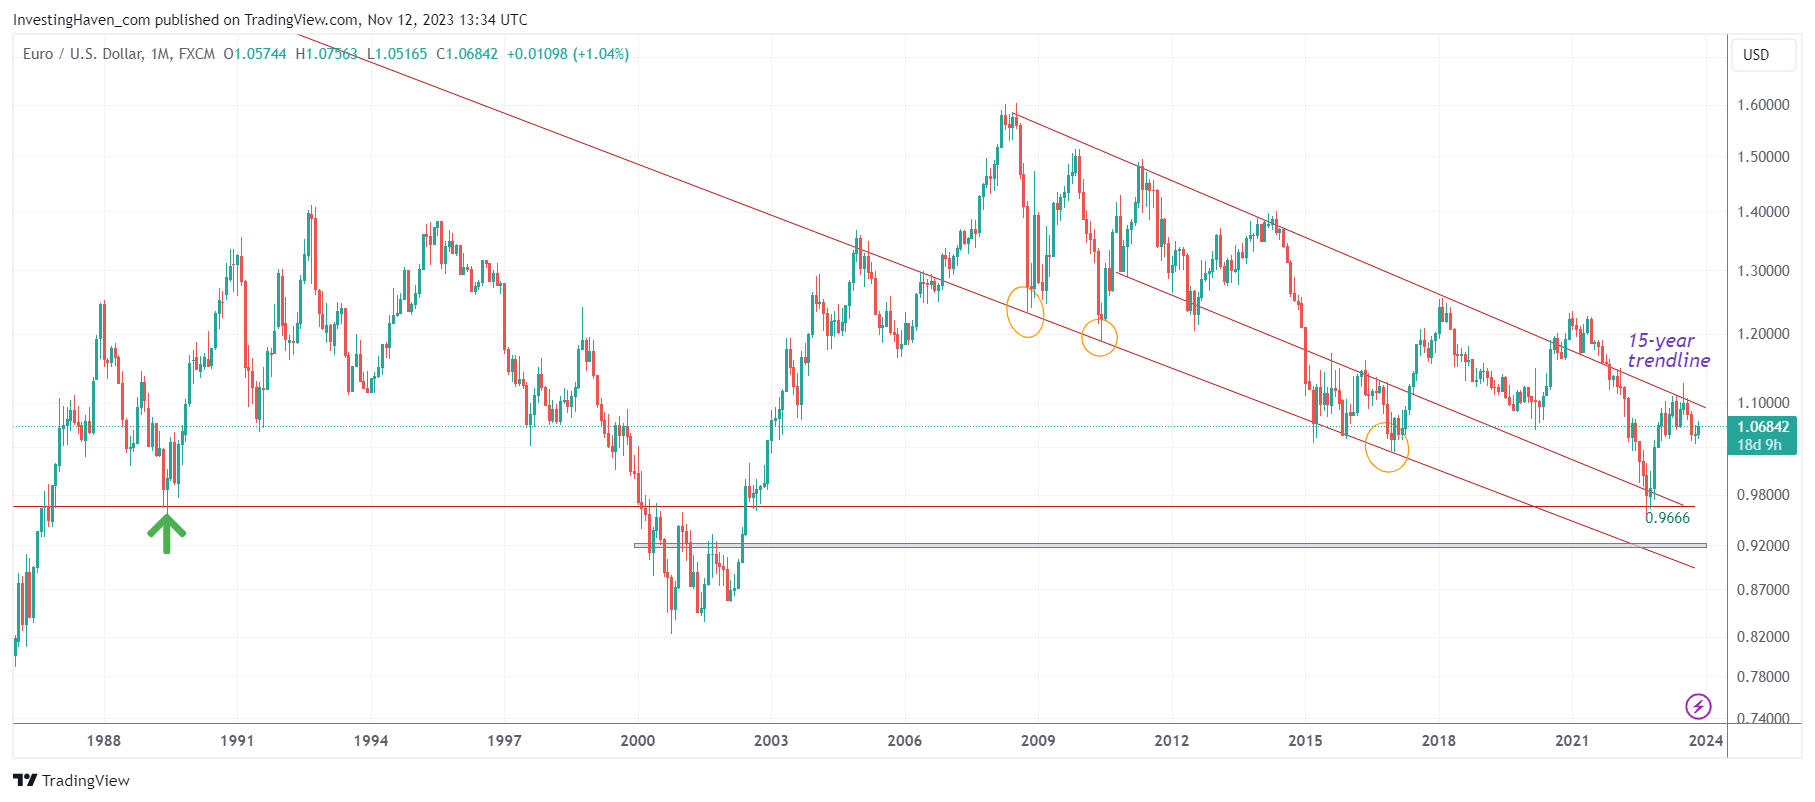
Stated differently, even though it might be that the U.S. Dollar has more upside (more downside in the Euro), we believe that there is more downside risk in the USD than upside potential. Pending validation and an important pre-requisite for our bullish silver price forecast 2024 to materialize.
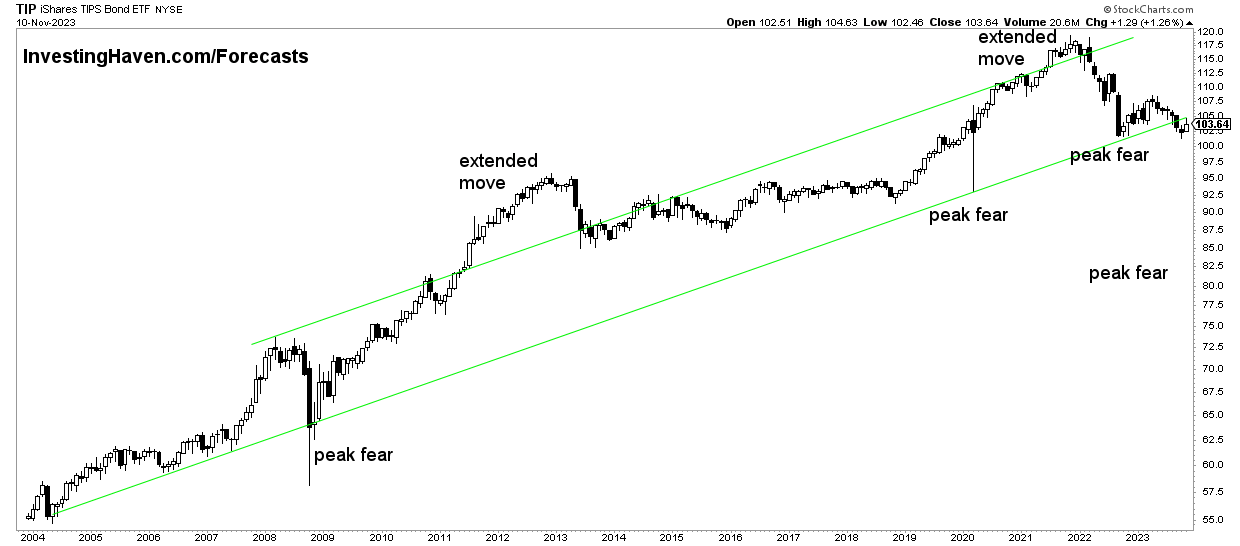
Silver’s leading indicator #3: Inflation expectations
Inflation expectations are positively correlated to precious metals. They are a very strong a leading indicator, certainly when combined with the USD/ Euro effect.
The long term setup in TIP seems to be hitting a multi-decade low in the context of its rising channel. Can TIP move lower? While everything is possible, we see that the recent decline was equally large as the previous ones in 2008 and 2020. That’s why we believe TIP is about complete its consolidation and move higher in 2024. We see a double bottom between Oct 2022 and Oct 2023 which should resolve higher, making it possible for silver to stage its long-overdue and long-awaited rally in the first half of 2024!
The medium term chart of silver / SPX / TIP, shown below, makes the point: a turning point in all three markets is not far away. All three should resolve higher in 2024, even if they decide to continue their downtrend before 2024 starts.
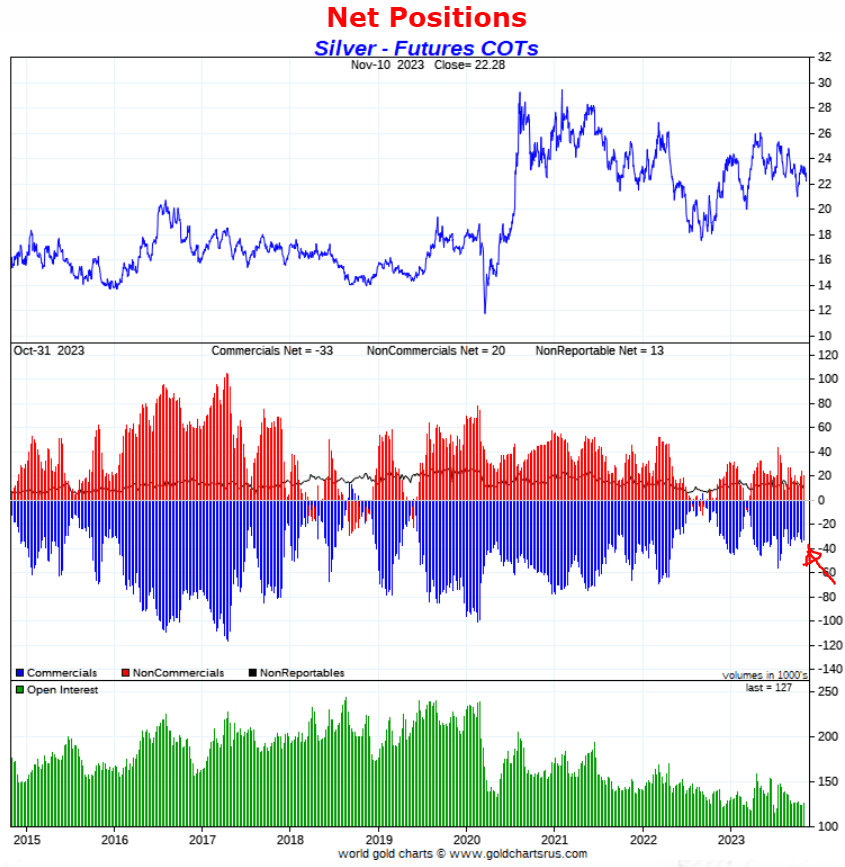
Silver’s leading indicator #4: Futures market (CoT)
This is the most bullish leading indicator for silver, way before 2024 kicks off. This leading indicator will act like fuel in 2024 whenever the other leading indicators turn bullish for silver!
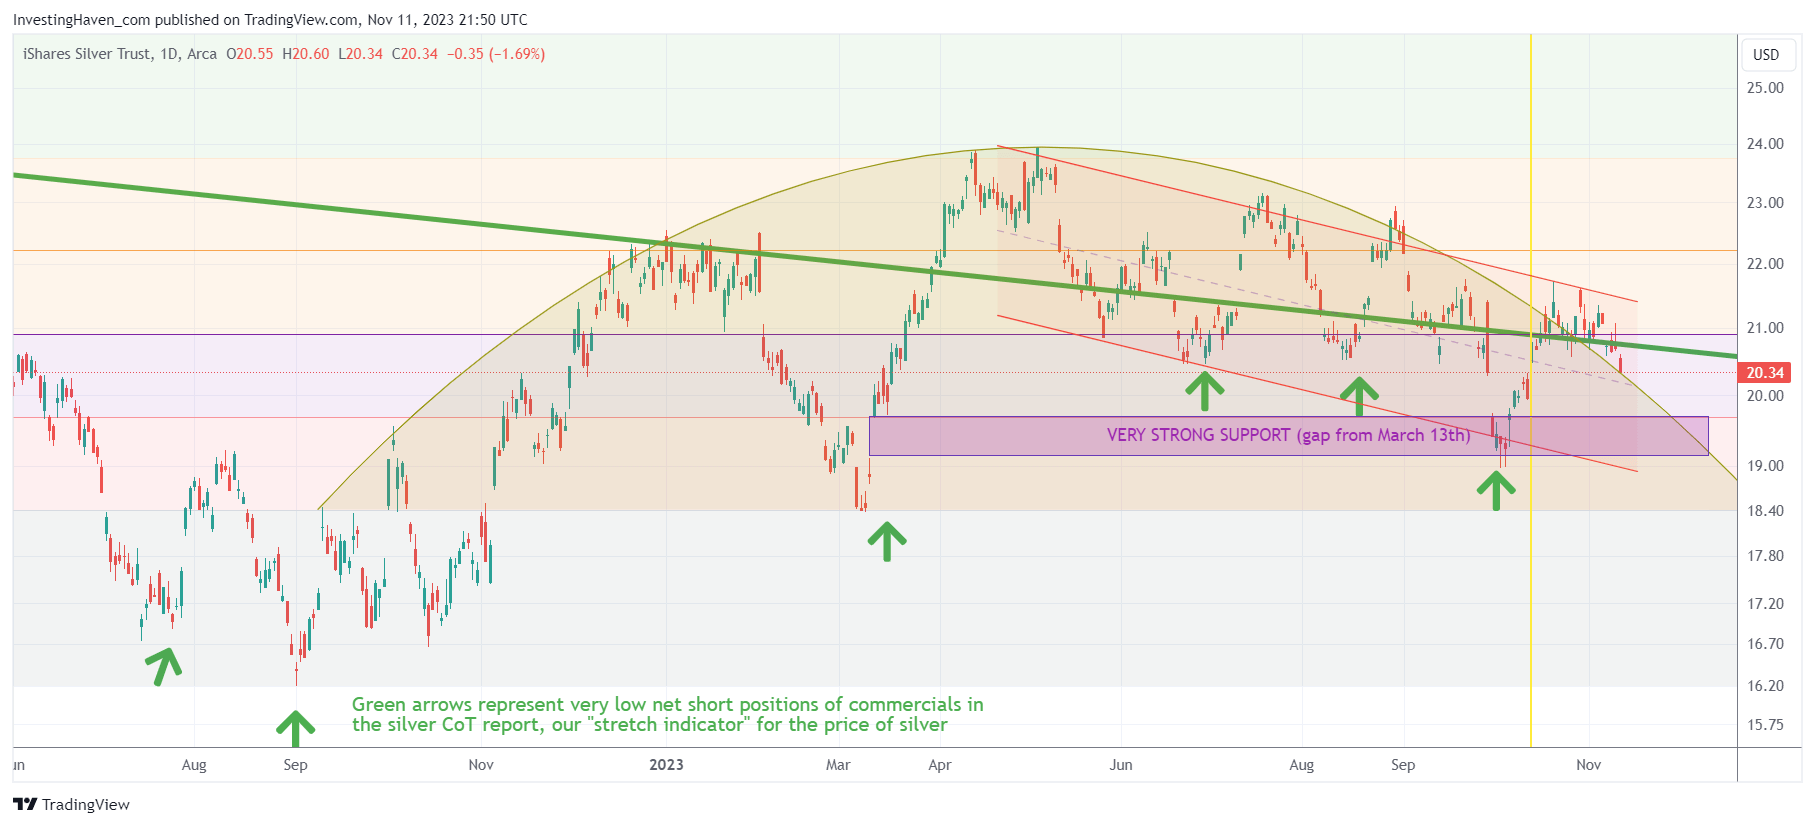
The way to think of this leading indicator for silver is a stretch indicator:
- When net positions in the futures market of commercials and non-commercials are stretched it indicates that price is going to take a turn.
- This is not a timing indicator, we need the silver price chart to determine the timing of a turning point.
- Right now, as per the data on the center pane (blue and red bars) we see that commercials and non-commercials have extremely low net positions, historically low. This is a setup that supports rising silver prices.
- What we want to see in 2024 is the red and blue bars rising not so fast as the price of silver is moving towards 28 USD, the secular breakout point.
We recommend reading Ted Butler’s work who is the expert in reading the CoT report in silver. He also explains how price setting in the silver market is dominated by CoT. He is a lonely voice in pointing out how tight the physical silver market currently is, as we head into 2024, because of an epic turnover in physical silver warehouses.
Comment added on November 12th, 2023: The silver CoT report remains very bullish, from an historical perspective. There is plenty of upside potential in the price of silver before it gets stretched.
Physical silver market: physical shortage in 2023 & 2024
As discussed in our recent article that talks about the developing silver shortage, a supply deficit is growing in the physical silver market.
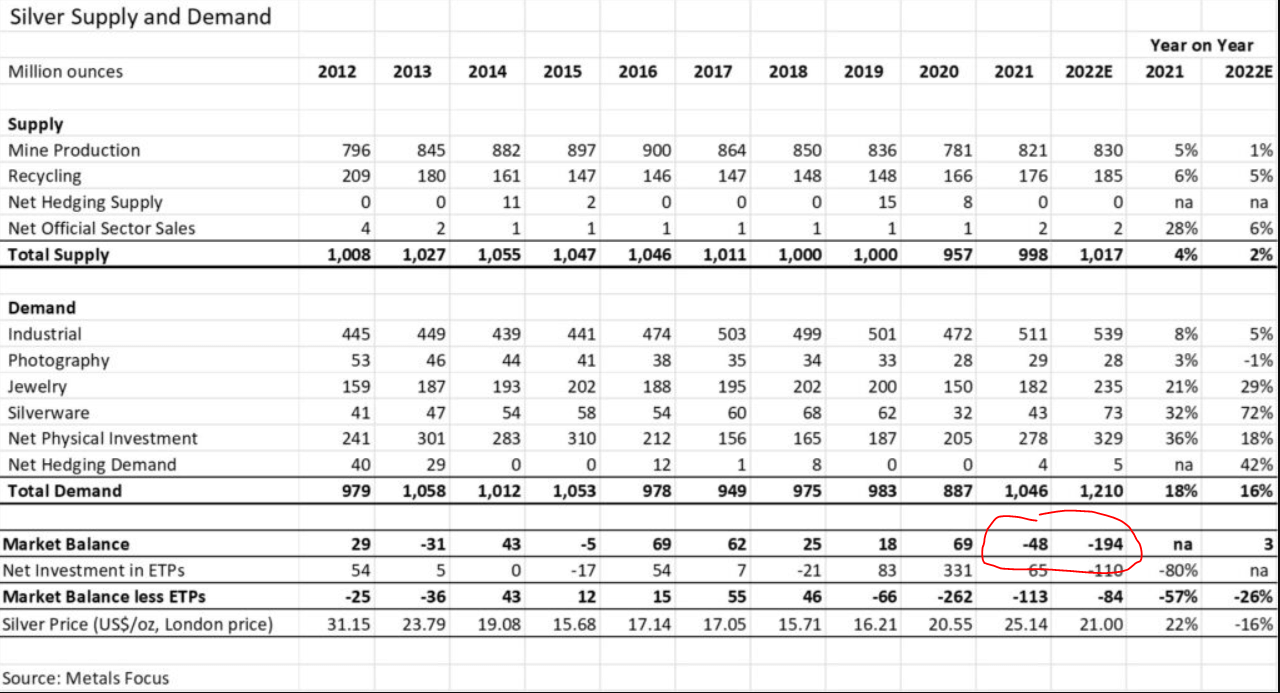
According to The Silver Institute) the global silver market should record a deficit in 2022. “At 194 Moz, this will be a multi-decade high and four times the level seen in 2021.”
As seen on the table which depicts the supply/demand situation in the last 10 years, it becomes clear that 2022 will be year with an epic physical market shortage. The strength of the physical shortage is the one conclusion that stands out, see red annotation.
As said, “this physical market imbalance (supply shortage) is historic, it’s not just a big supply shortage jump of 4x against last year.”
As 2024 kicks off, the shortage did not resolve. In fact, there is an increasing number of signs that the shortage is only intensifying. Sooner rather than later, silver’s physical market shortage should be reflected in the price of silver.
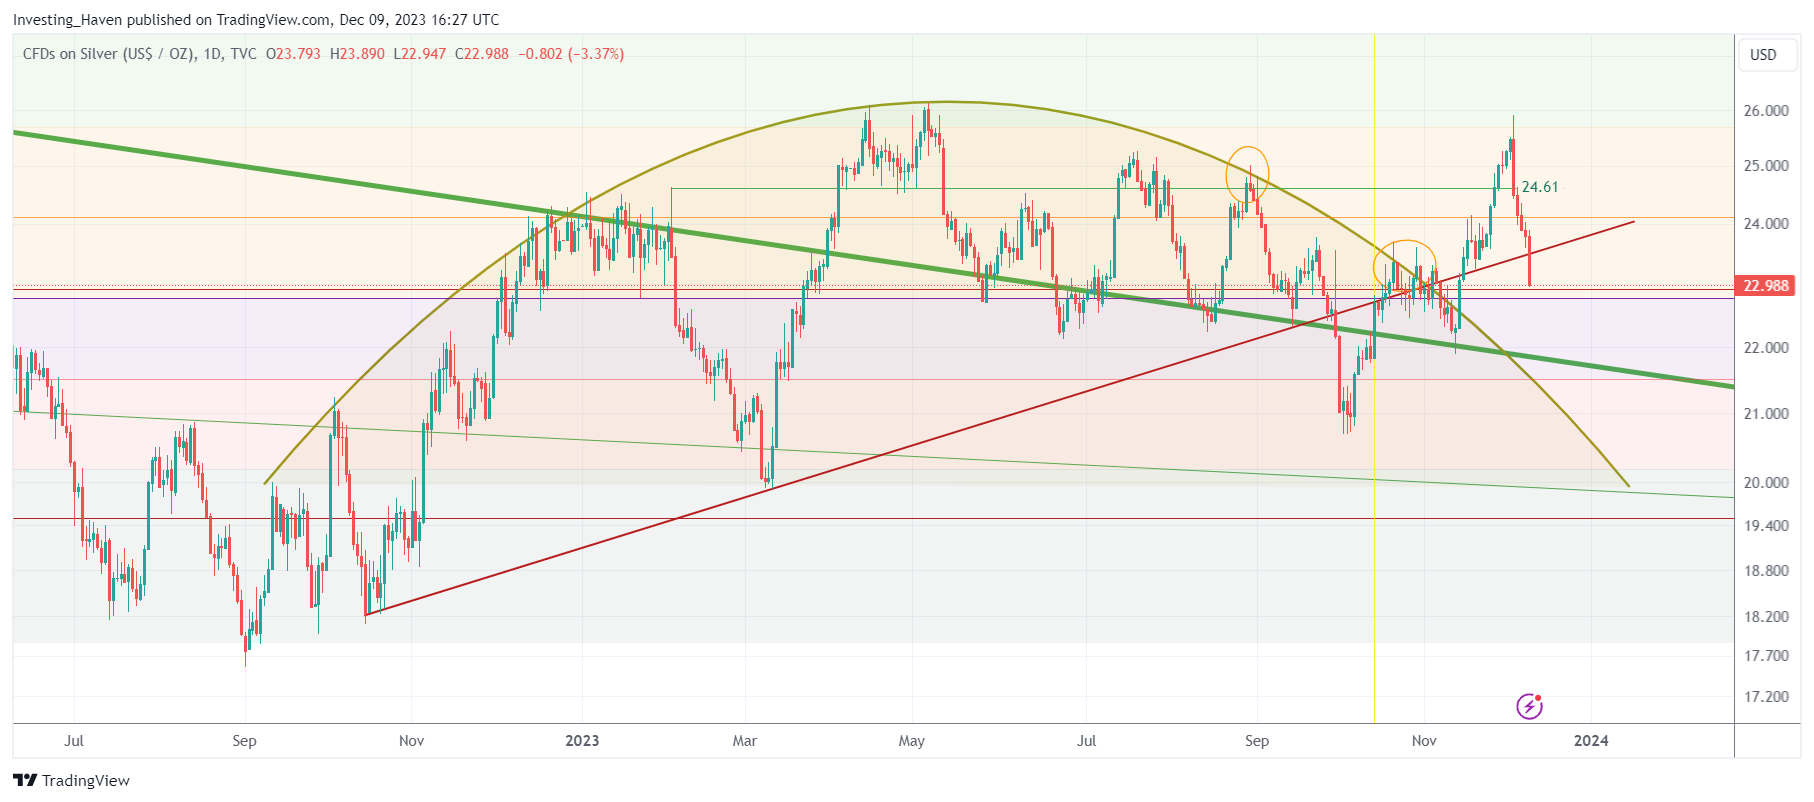
Silver price chart: a bullish reversal is almost complete
What do we see?
A bullish reversal setup that is testing the edges. While not really visible on this chart, there is a rounded pattern that is close to being resolved.
Silver price forecast 2024: conclusion
That was a lot information to take in, so let’s ensure we come to a very clear and simple conclusion:
- Leading indicators Euro and inflation expectations turned bearish in Q2/2022, pushing silver lower.
- The silver CoT turned extremely, historically bullish as we head into 2024.
- Once inflation expectations start rising, accompanied by a confirmed top in 10-Year Yields, we silver see taking off.
That’s why we see silver easily moving to 28 USD in 2024 and moving to our first and longstanding bullish target of 34.70 USD. Our silver price forecast 2024 is 34.70 USD. Whatever happens at that price point will inform us about the intention of silver to attack ATH, presumably beyond 2024.
Bonus chart: Silver and Tesla comparison
Every investor talks about the big Tesla opportunity of recent years. If you would have invested in Tesla back in 2017 or 2018, had done nothing for a few years, your position would have exploded.
Here is the problem: Tesla first sold off before taking off. Most investors sold on fears that Tesla would start crashing.
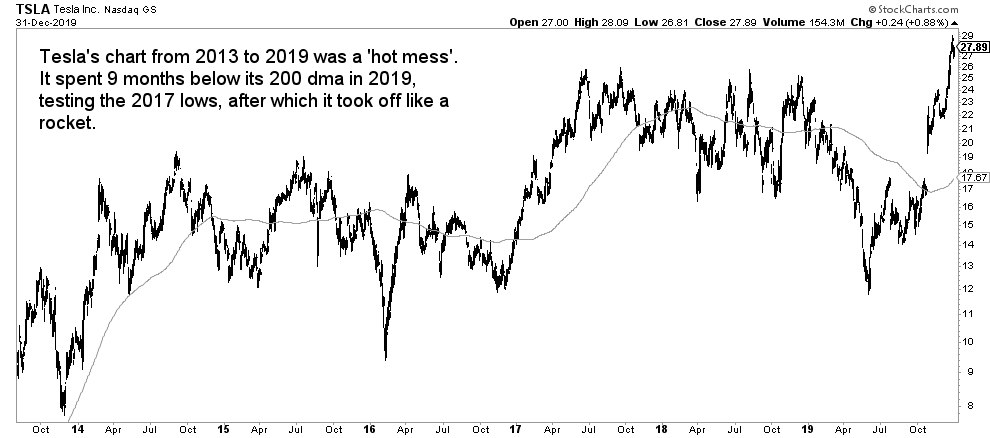
Interestingly, there are similarities between the Tesla setup back in 2019 (before it exploded) and the silver price as we head into 2024.
Tesla’s daily chart between 2013 and 2019 was a ‘hot mess’. It spent 9 months below its 200 day moving average before it tested the support area. In doing so, the price of Tesla went from 25 to 12 in some 6 months. Not a lot of investors were holding those shares.
Technical analysts would have told you to run for the hills.
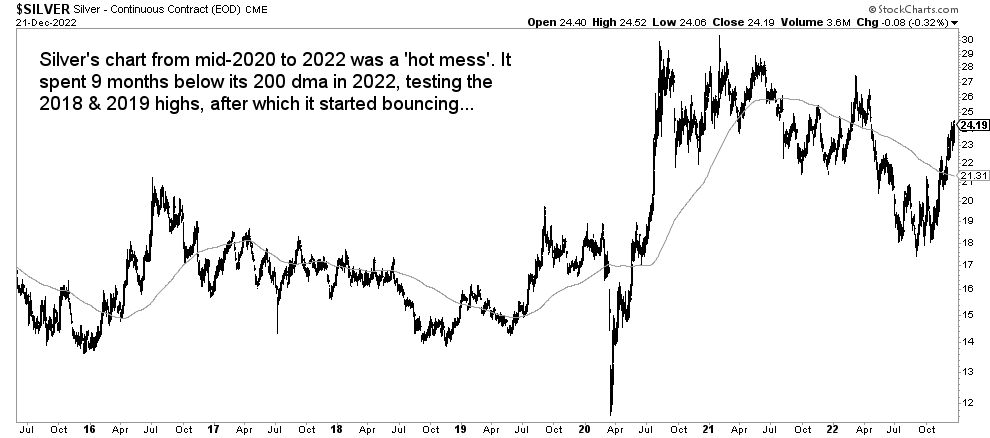
Fast forward to today and look at the silver price chart.
Well, silver concluded 9 months below its 200 day moving average after it came down from 27 to 17 USD/oz. It spent several months right at its 2017/2018/2019 highs and it looks like it successfully confirmed it as key support.
Now, here is the point: if you ask any investor today if they would have held their Tesla shares even if they would have sold off but got in return a 10x ride, the answer unanimously would have been ‘yes’.
The reality is different: most sold their Tesla shares back in 2018 & 2019.
If you ask any investor today to consider silver, they would tell you it’s only a fool that is investing silver because, among other reasons, (a) rates are too high (b) the USD is too high (c) the world does not care about silver (d) silver has gone anywhere in recent years (e) silver is too volatile (f) silver came down so much. Note that this list is not exhaustive.
You got our point: if the big silver move is about to start in 2024, which we firmly believe is the case, you MUST be in an environment characterized by disbelief in the investment. Because if there were too much belief in silver as an investment, there would be no opportunity.
You got our point?
Please read this a few times, it’s crucial, timely insights, we explained more of these principles in 7 Secrets of Successful Investing.
Silver price prediction log
This is a log of our silver price prediction that we’ll update multiple times throughout 2024, ideally once per month.
[added on Nov 26th, 2023] Silver is now confirming a breakout on its daily price chart. The 22.50-23.00 USD/oz area was a breakout point, silver now trades for several consecutive days above this level. A breakout is almost confirmed on the daily chart. However, on the weekly chart we need silver to cross 25 USD/oz as the breakout level. On the quarterly, as said above, it is 27-28 USD/oz where the breakout level comes in.
[added on Dec 11th, 2023] The price of silver experienced a steep drop in the first week of December of 2023. It created a local top on the silver price chart, with a structure that looks a lot like the start of a reversal. While it will take time for silver to recover from this, we continue to believe that this price drop will qualify as a successful breakout back-test with a back-test of the 50% retracement level.
Our track recording predicting the price of silver
For 5 years in a row our silver forecasts were phenomenally accurate. They are all still available in the public domain on our blog, and the table below depicts the summary of each year’s silver forecast with the highs/ lows per year.
Interestingly, InvestingHaven’s research team has been spot-on with its gold price forecasts for 5 consecutive years. However, in 2021 and 2022, the price of silver came close to our silver forecast but eventually did not materialize.
We firmly believe that our silver price forecasts of 2022 and 2023 will materialize in 2024. Our longstanding targets are 34.7 and 40 USD, they should be met and probably exceeded not later than 2024.
This is an overview of our silver price forecasts from last year. We publish these forecasts many months prior to the year that we forecast. Prices reflect silver’s spot price.
| Year | Our silver forecast | Lows Highs | Forecast accuracy |
|---|---|---|---|
| 2017 | Neutral, price target of $15 | 14.41 18.65 | Spot-on |
| 2018 | Neutral, no breakdown | 13.91 17.68 | Spot-on |
| 2019 | Bullish with price target of $20-21 | 14.30 19.64 | Spot-on |
| 2020 | Bullish with price target of $22 | 11.65 29.64 | Spot-on |
| 2021 | Bullish with price target of $37 | 21.42 30.37 | Missed |